A look at FIFA World Cup history from 1930 to 2018
Published
February 5, 2023
Inspired by Tidy Tuesday
Inspired by the November 29, 2022 Tidy Tuesday dataset on FIFA World Cup matches played in its history from Uruguay in 1930 to Russia in 2018. I primarily wanted to take a look at total goals scored, frequency of winners and increase in attendance.
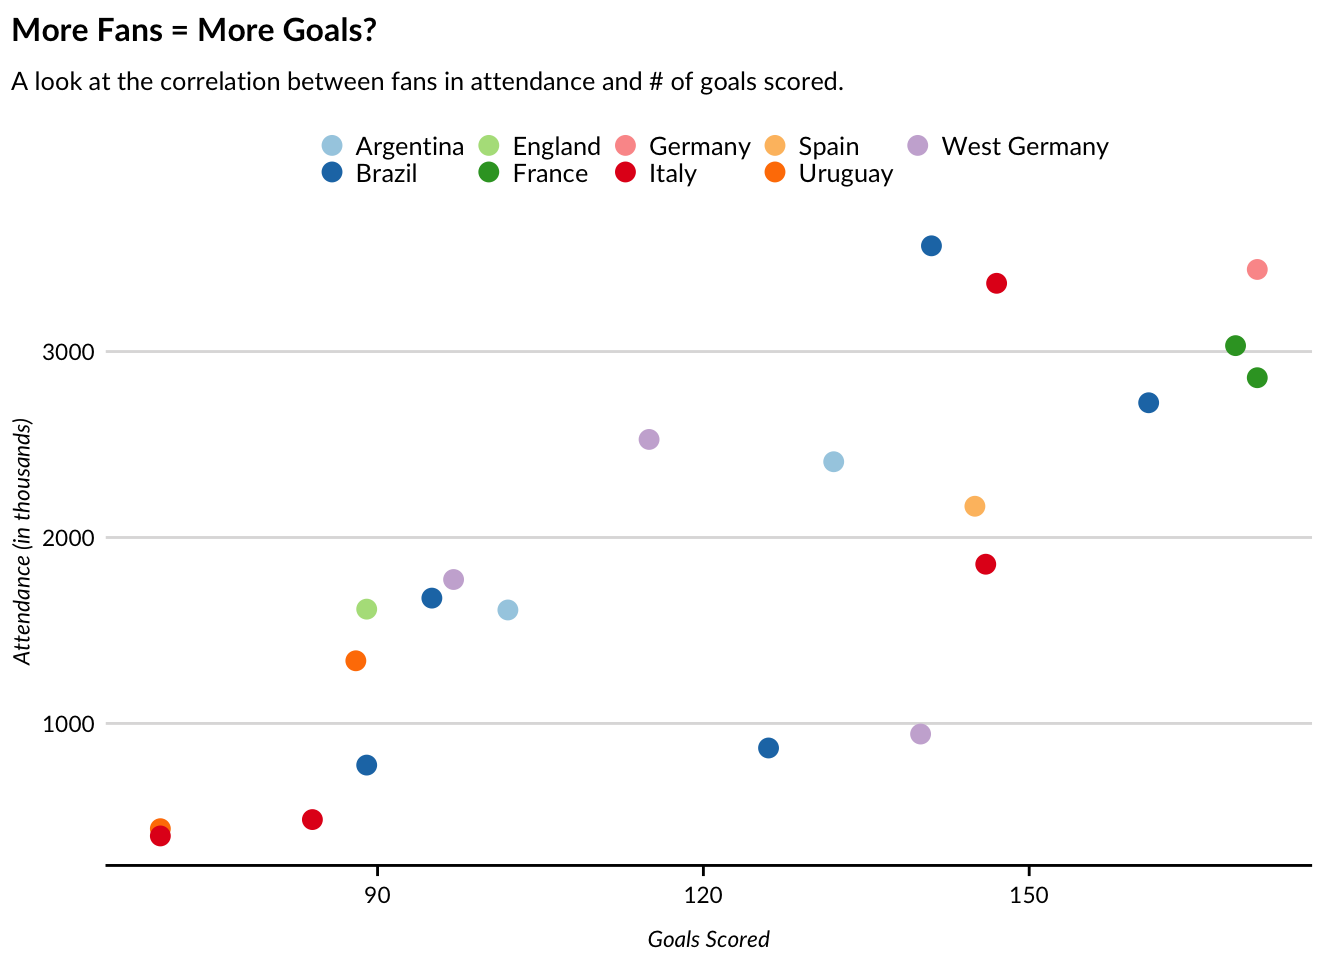
Goals vs. Attendance
The first thing I wanted to explore was the correlation, if any, between the amount of goals scored in all world cup games and the amount of fans in the stands. It definitely appears that as attendance increases goals also increase.
Behind the scenes
worldcups %>%ggplot(aes(x=goals_scored, y=attendance/1000, color=winner,text=winner))+geom_point()+labs(title ="More Fans = More Goals?",subtitle ="A look at the correlation between fans in attendance and # of goals scored.",plot.title =element_text(face="bold"),x ="Goals Scored",y ="Attendance (in thousands)",color ="Winning Country",size="" )+scale_color_brewer(palette ="Paired")
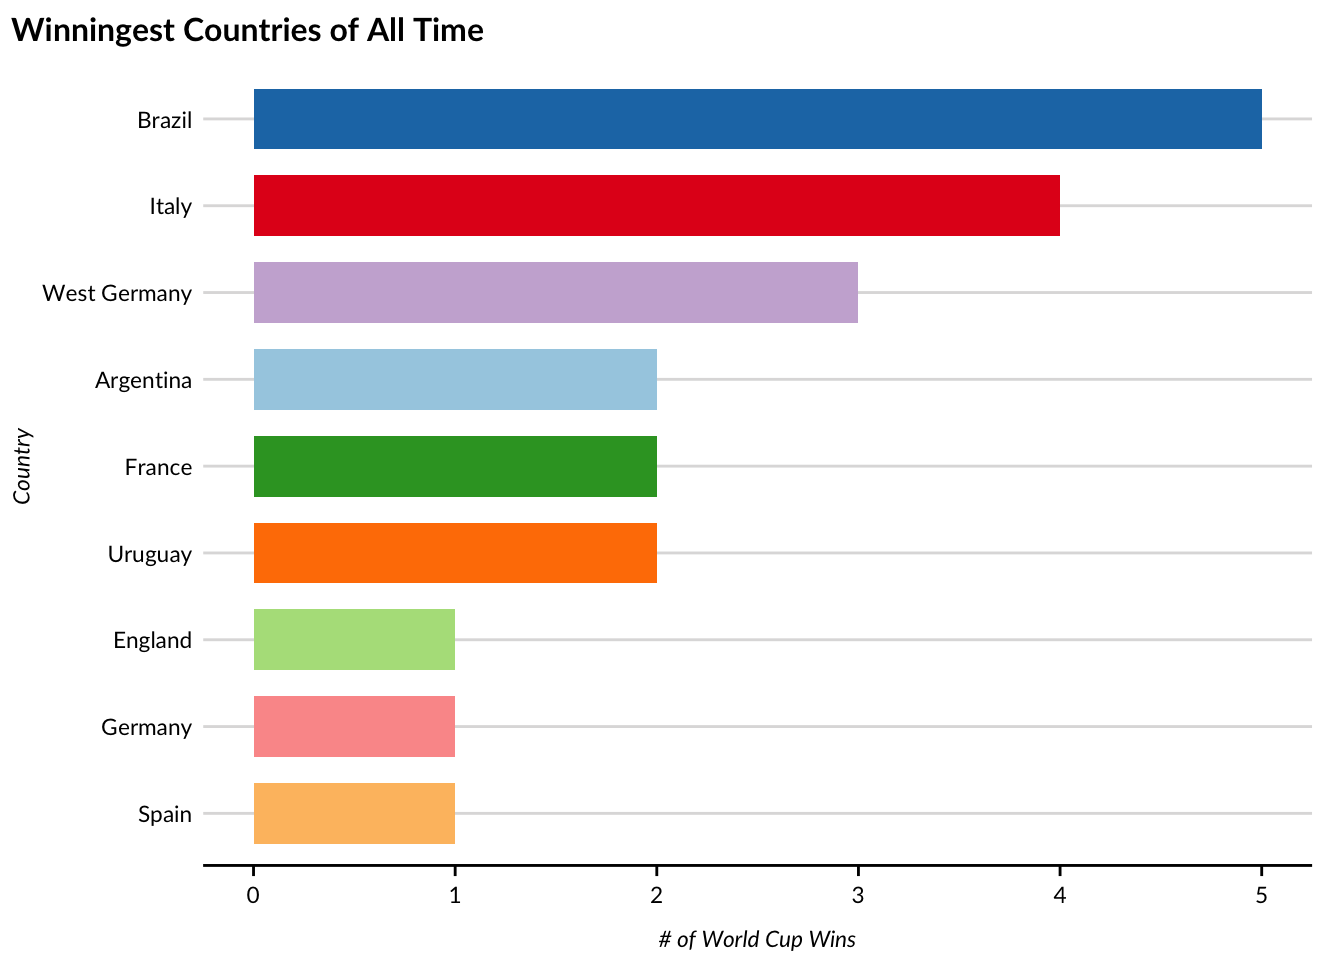
Overall Winners
I also wanted to explore who the top winners were throughout the history of the World Cup.
Behind the scenes
worldcups %>%ggplot(aes(x=forcats::fct_rev(fct_infreq(winner)),text=winner,fill=winner))+geom_bar(stat="count")+labs(title ="Winningest Countries of All Time",plot.title =element_text(face="bold"),legend.title =element_text(margin =margin(0, 0, 15, 0)),legend.position ="right",legend.justification ="top",x ="Country",y ="# of World Cup Wins",color ="Winning Country",size="" )+coord_flip()+scale_fill_brewer(palette ="Paired")+theme(legend.position="none")