Let’s Recreate: Fight Songs
R
ggplot2
FiveThirtyEight
Shiny
Plotly
A recreation, alternate and interactive plot for school fight songs
Plot Recreation
This was part of an assignment to take a FiveThirtyEight chart and see how close we could get to the original.
Behind the scenes
justOregon<-subset(fight.songs,fight.songs$school=="Oregon State")

ggplot(data=fight.songs, aes(x=sec_duration, y=bpm, color=hex))+
  geom_point(alpha=.2, size=4)+
  scale_x_continuous(breaks=c(0,20,40,60,80,100,120,140,160,180), limits=c(0,180))+
  scale_y_continuous(breaks=c(60,80,100,120,140,160,180,200), limits=c(40,200))+
  geom_point(data=justOregon, aes(x=sec_duration, y=bpm, fill="#DC4405", color="#000000"), shape=21, size=4, stroke = 1)+
  geom_text(data=justOregon, aes(label=school, fontface="bold"), position = position_nudge(y = 12)) +
  geom_hline(yintercept = mean(fight.songs$bpm), linetype='dotted', color="black")+
  geom_vline(xintercept = mean(fight.songs$sec_duration), linetype='dotted', color="black")+
  scale_color_manual(values=fight.songs$hex)+
  labs(
    title = "How the Oregon State fight song stacks up",
    x = "Duration",
    y = "Beats per minute"
  ) +
  guides(color="none",fill="none")+
  theme_minimal()+
  theme(
    panel.grid.minor = element_blank(),
    aspect.ratio=3/4,
    axis.title = element_text(face="bold"),
    title = element_text(face="bold"),
  )+
  annotate("text", x = 30, y = 190, label = "Fast and short", family="mono")+
  annotate("text", x = 160, y = 190, label = "Fast but long", family="mono")+
  annotate("text", x = 30, y = 45, label = "Slow but short", family="mono")+
  annotate("text", x = 160, y = 45, label = "Slow and long", family="mono")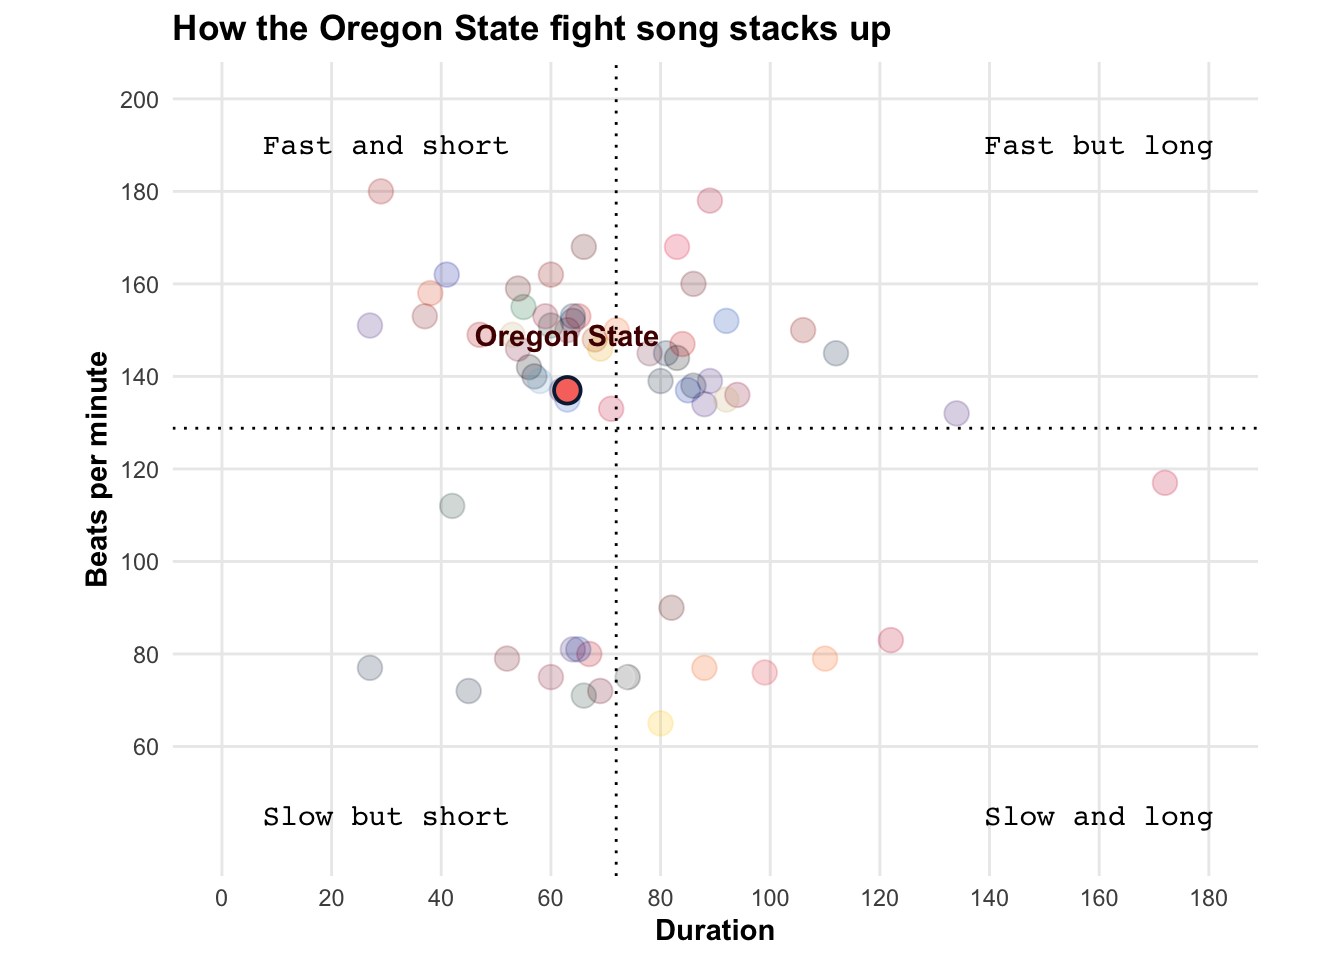
Alternative Plot
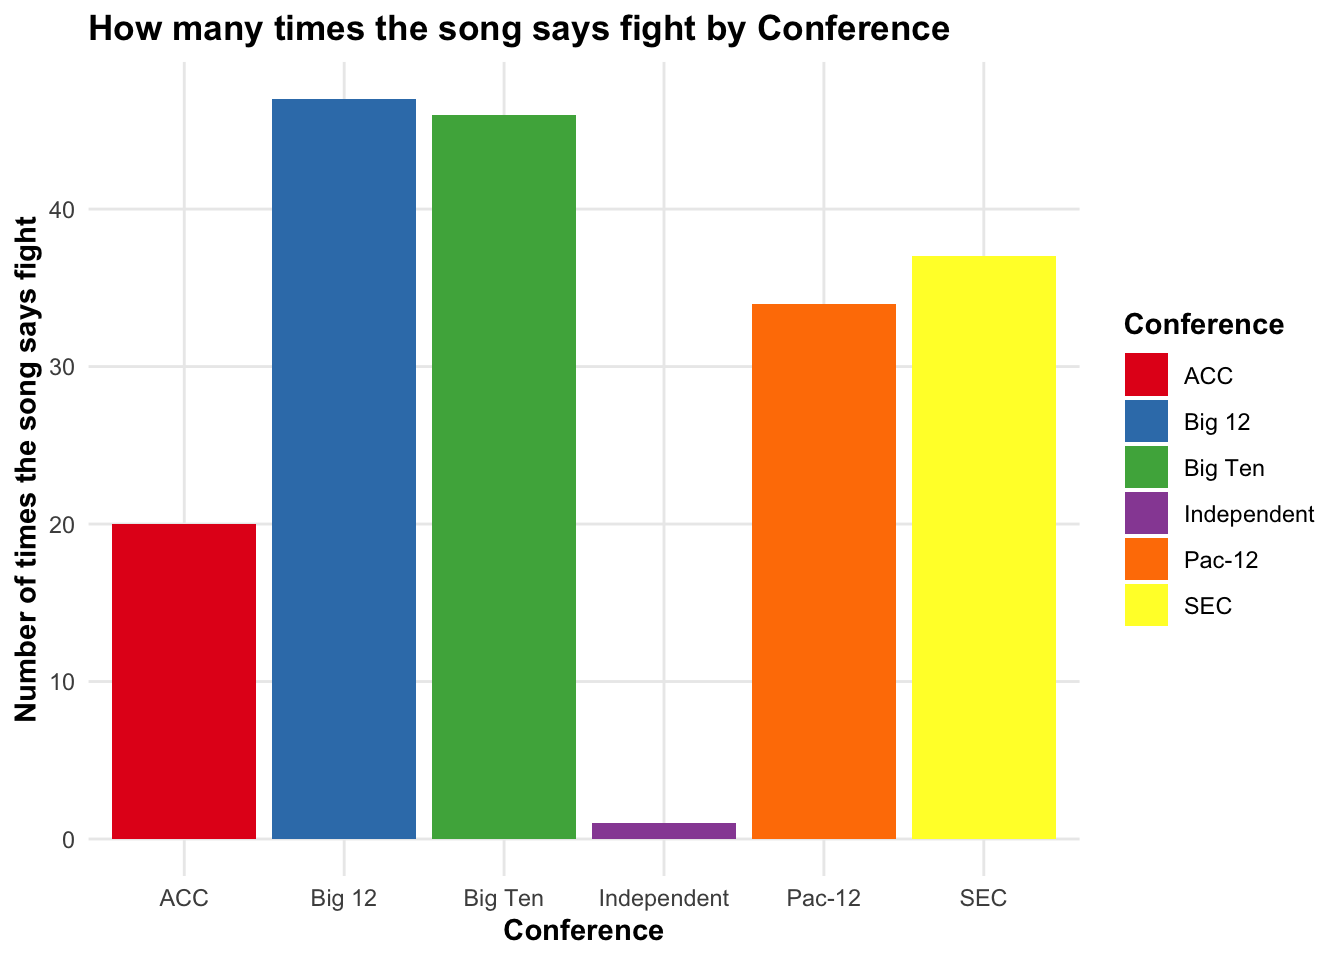
The next step in the assignment was to come up with an alternate plot using the data provided. I thought it might be interesting to look at the number of times the word “fight” was actually used in school fight songs, by conference.
Behind the scenes
fight.songs %>%
  group_by(conference) %>%
  summarise(sumfight = sum(number_fights)) %>%
  ggplot(aes(x = conference, y = sumfight, fill = conference)) +
  geom_col()+
  theme_minimal()+
  theme(
    panel.grid.minor = element_blank(),
    axis.title = element_text(face="bold"),
    title = element_text(face="bold"),
  )+
  scale_fill_brewer(palette="Set1")+
  labs(
    title = "How many times the song says fight by Conference",
    x = "Conference",
    y = "Number of times the song says fight",
    fill="Conference"
) 
Interactive Plot
The final step in the process was to create an interactive plot. This is a Shiny app that uses plotly for some interaction.
Behind the scenes
library(shiny)
library(plotly)

#import data
fight.songs <-
  read.csv("https://raw.githubusercontent.com/kitadasmalley/DATA502/main/FALL2022/Data/fight_songs_HKS.csv", stringsAsFactors=FALSE)

# Define UI
ui <- fluidPage(
  tags$style(
    "h2 {
      font-family: Helvetica, Arial, sans-serif;
      font-weight: 600;
    }
    p{
    margin-bottom: 0;
    }
    hr{
    margin: 14px 0;
    border-top: 1px solid #333;
    }
    "
  ),
  # Application title
  titlePanel("Our Guide To The Exuberant Nonsense Of College Fight Songs"),

  # Sidebar with a slider input the year
  sidebarLayout(
    sidebarPanel(
      selectInput("school",
                  h4("Choose your school:"),
                  choices = c("", unique(fight.songs$school)),
                  selected = NULL,
                  multiple = FALSE),
      htmlOutput("text1")
    ),
    # the school scatterplot
    mainPanel(
      plotlyOutput("bandPlot")
    )
  )
)

# Define server
server <- function(input, output) {

  output$bandPlot <- renderPlotly({
    justSelected<-subset(fight.songs,fight.songs$school==input$school)
    p<-fight.songs%>%
      ggplot(aes(x=sec_duration, y=bpm))+
      geom_point(aes(text=school),alpha=.2, size=4, color=fight.songs$hex)+
      scale_x_continuous(breaks=c(0,20,40,60,80,100,120,140,160,180), limits=c(0,180))+
      scale_y_continuous(breaks=c(60,80,100,120,140,160,180,200), limits=c(40,200))+
      geom_point(data=justSelected, aes(x=sec_duration, y=bpm), color=justSelected$hex, size=4)+
      geom_text(data=justSelected, aes(x=sec_duration, y=bpm, label=school, face = 2), nudge_y =10)+
      geom_hline(yintercept = mean(fight.songs$bpm), linetype='dotted', color="black")+
      geom_vline(xintercept = mean(fight.songs$sec_duration), linetype='dotted', color="black")+
      scale_color_manual(values=fight.songs$hex)+
      labs(
        title = paste("How the",input$school,"fight song stacks up"),
        x = "Duration",
        y = "Beats per minute"
      ) +
      guides(color="none",fill="none")+
      theme_minimal()+
      theme(
        panel.grid.minor = element_blank(),
        aspect.ratio=3/4,
        axis.title = element_text(face="bold"),
        title = element_text(face="bold"),
      )+
      annotate("text", x = 30, y = 200, label = "Fast and short", family="mono")+
      annotate("text", x = 160, y = 200, label = "Fast but long", family="mono")+
      annotate("text", x = 30, y = 45, label = "Slow but short", family="mono")+
      annotate("text", x = 160, y = 45, label = "Slow and long", family="mono")

    ggplotly(p)%>%
      layout(
        hoverlabel = list(font=list(size=14))
      )
    })
  observeEvent(input$school, {
    justSelected<-subset(fight.songs,fight.songs$school==input$school)
    totalWord<-sum(justSelected[,c(12,14,15,17:22)] == 'Yes')
    output$text1 <- renderUI({
      str<-paste("<h4>Fight song clichés</h4><p>How many common clichés are in your school fight songs.</p>")
      str1<-paste("Fight:", justSelected$fight)
      str2<-paste("Victory:", justSelected$victory)
      str3<-paste("Win:", justSelected$win_won)
      str4<-paste("Rah:", justSelected$rah)
      str5<-paste("Nonsense syllables:", justSelected$nonsense)
      str6<-paste("School colors:", justSelected$colors)
      str7<-paste("Men, boys, sons:", justSelected$men)
      str8<-paste("Name of opponent:", justSelected$opponents)
      str9<-paste("Spell something out:", justSelected$spelling)
      str10<-paste("<hr/><b>Total clichés:</b>",totalWord)
      HTML(paste(str,str1, str2, str3, str4, str5, str6, str7, str8, str9, str10, sep="<br/>"))
      })
  })
}
# Run the application
shinyApp(ui = ui, server = server)